The profile
The profile is ELLIPROF's main result: one set of numbers for each fitted isophote. elliprof writes it in two formats with the same content:
| Option | File |
|---|---|
-o FILE |
ELLIPROF's native text profile format, at full precision, with the run settings and the image header (traditionally n1234.dat) |
--csv FILE.csv |
a commented, comma-separated table, one row per isophote |
In Python, result.profile (from run_elliprof) or
elliprof.read_profile("n1234.dat") gives the same table as a pandas
DataFrame.
The profile is not an image
The -o file is a table of numbers, not a picture. You cannot open
it in DS9. To see the fit, use the DS9 region file (--reg) on the
image, the model image (-m) or the residual (--residual).
See Model, residual and prepared images.
File names: .dat and .prf
In the traditional ELLIPROF naming, n1234.dat is this text profile
and n1234.prf is the FITS model image written by -m. Older
elliprof documentation (0.1.0–0.1.3) called the text profile .prf
instead. The names do not matter to elliprof, which never checks or
adds extensions: -o always writes the text profile and -m always
writes a FITS image.
If you give neither -o nor --csv, the profile table is printed on the
terminal instead.
Columns
| Column | Unit | Meaning |
|---|---|---|
Rmaj |
pixels | semi-major axis a of the isophote |
x0, y0 |
pixels | fitted centre of this isophote, in ELLIPROF coordinates |
I0 |
image units / pixel | intensity of the isophote, after the sky is subtracted |
alpha |
degrees, 0–180 | position angle of the major axis, counter-clockwise from the image +y axis. From +x it is alpha + 90 |
ellip |
ellipticity 1 − b/a | |
I3, I4 |
fraction of I0 |
amplitude of the 3rd/4th-order intensity variation around the isophote |
A3, A4 |
degrees | their phases, in eccentric angle from the major axis (A3 0–120, A4 0–90). Not position angles |
slope |
logarithmic slope d ln I / d ln r, from the neighbouring isophotes (set to −2 where it would be positive) |
The details are on What is an isophote?, How ELLIPROF fits a galaxy and Harmonic analysis.
What the profile does not contain
- No uncertainties. Estimate them yourself, for example from repeated fits with different masks, skies or starting values, or from simulations.
- No calibration.
I0is in image units per pixel. Converting to mag/arcsec² needs a zeropoint and a pixel scale; see Galaxy surface photometry. - No sky position angle.
alphais relative to the image axes.
The profile of UGC 12517
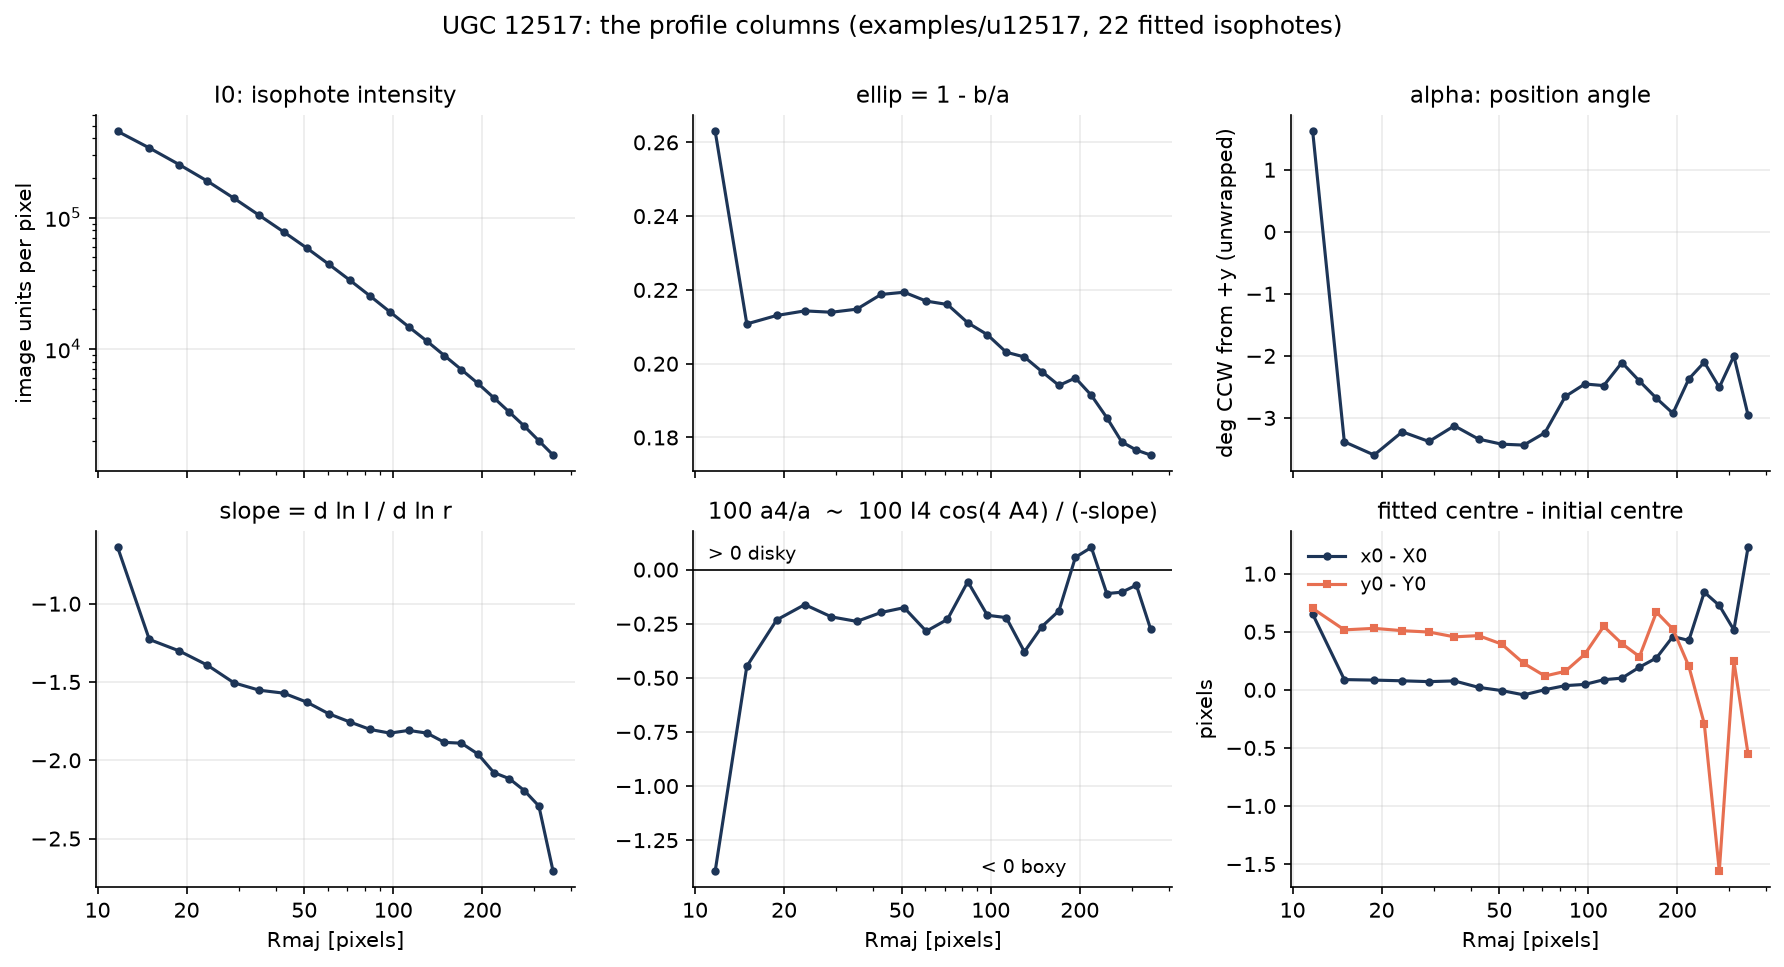
What you can read from it:
- The intensity falls smoothly, with no breaks.
- The ellipticity is about 0.21 out to ~70 pixels (9″), then falls slowly to 0.175: the galaxy is rounder in its outskirts.
- The position angle is constant to within about 1.5°: no isophote twist.
- The slope steepens outwards, as expected for an elliptical galaxy.
- a4/a is within a few tenths of a percent of zero: nearly pure ellipses.
- The centres agree to better than half a pixel inside ~100 pixels, and scatter by up to 1.5 pixels further out, where the galaxy is faint and heavily masked.
The second isophote (11.7 pixels) is also affected by the masked nucleus: its ellipticity and I4 differ from their neighbours.
Plotting conventions
Position angles near 0° and 180°
alpha is an axis direction, so 0° and 180° are the same. A galaxy
with its major axis near the image's y axis can jump between ~2° and
~178° from one isophote to the next, although the orientation has
barely changed. To plot it, unwrap the angles:
- Plot the radius on a log axis, or as \(r^{1/4}\) (a de Vaucouleurs law is then a straight line in magnitudes).
- Plot intensities on a log axis, or as surface brightness in magnitudes.
Reading the files
from elliprof import read_profile, read_prf

p = read_profile("u12517.dat")       # pandas DataFrame
print(p.attrs["scale"])              # SCALE= (arcsec/pixel), if given

raw = read_prf("u12517.dat")         # dict: n, scale, params (250 x 12), header
The CSV starts with # comment lines (input, mask, sky, parameters,
version, units, and the column names). elliprof reads it back with
parse_elliprof_csv:
from elliprof import parse_elliprof_csv
p, meta = parse_elliprof_csv("u12517.csv")    # DataFrame, dict of header lines
print(meta["Sky"], meta["Parameters"])
With another CSV reader, skip the # lines and supply the column names
(they are in elliprof.COLUMNS):
pandas.read_csv("u12517.csv", comment="#", header=None, names=elliprof.COLUMNS, skipinitialspace=True).